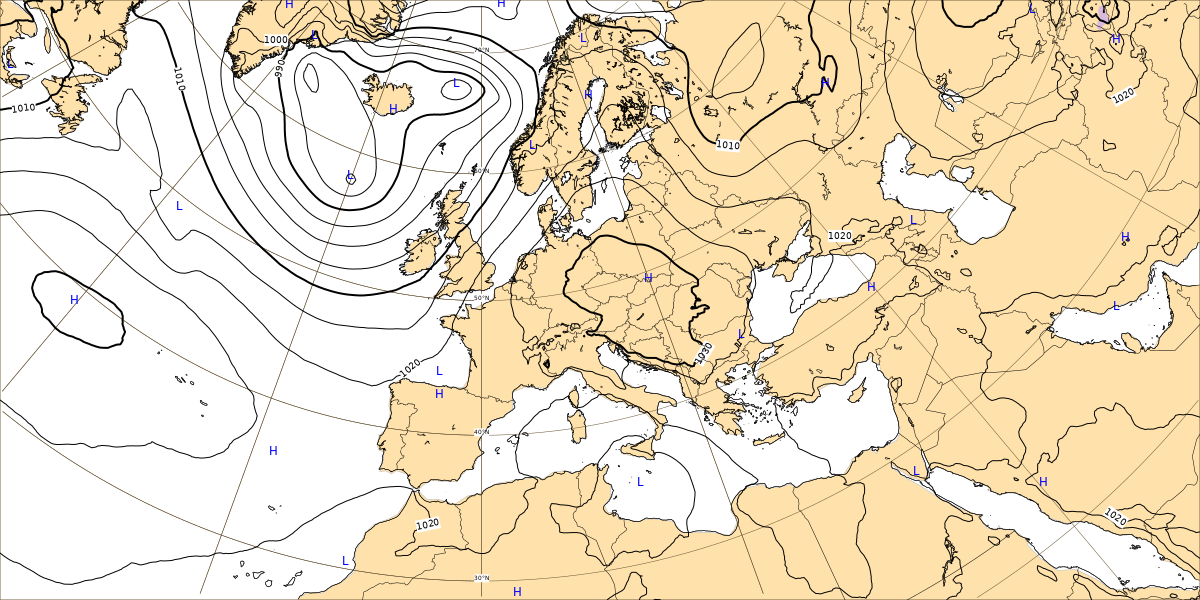
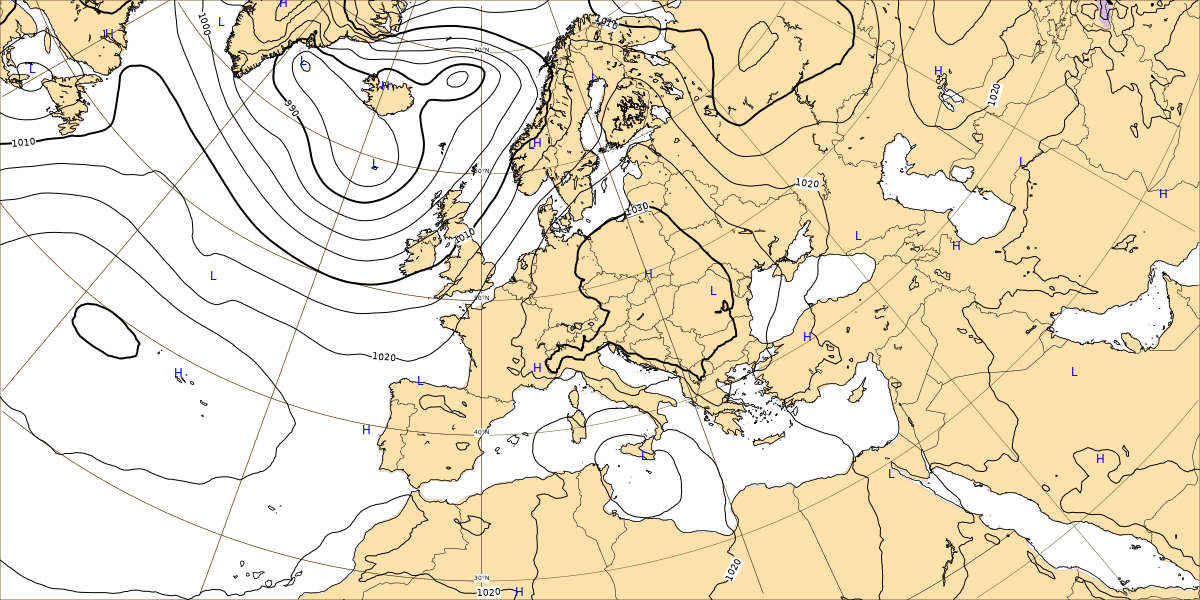
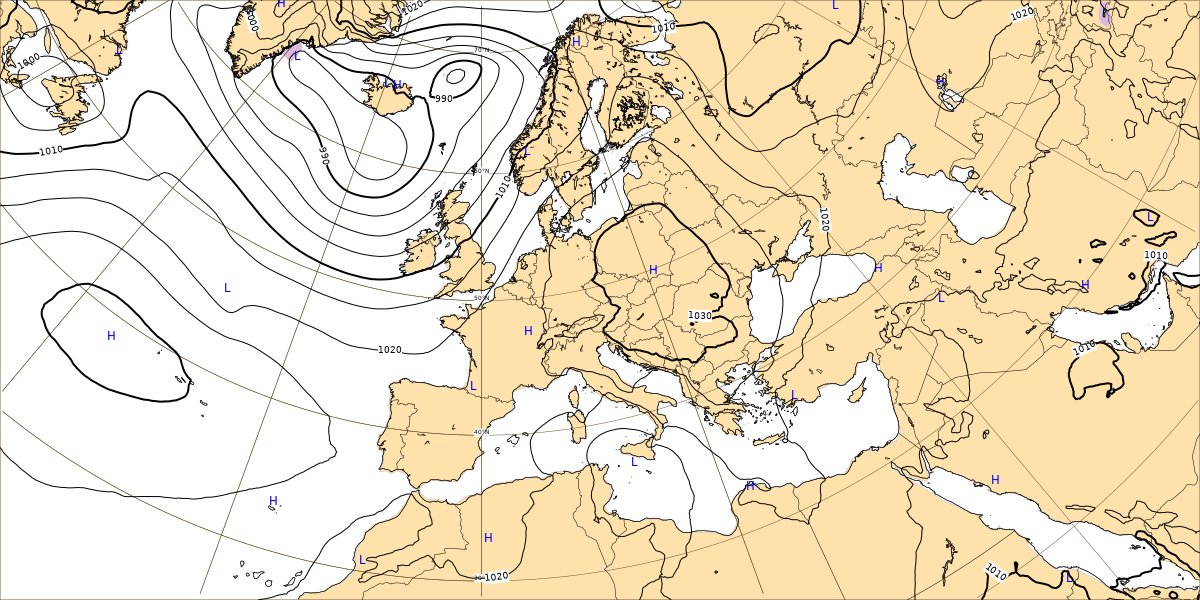
Ensemble mean and spread for Mean sea level pressure
Ensemble mean and spread
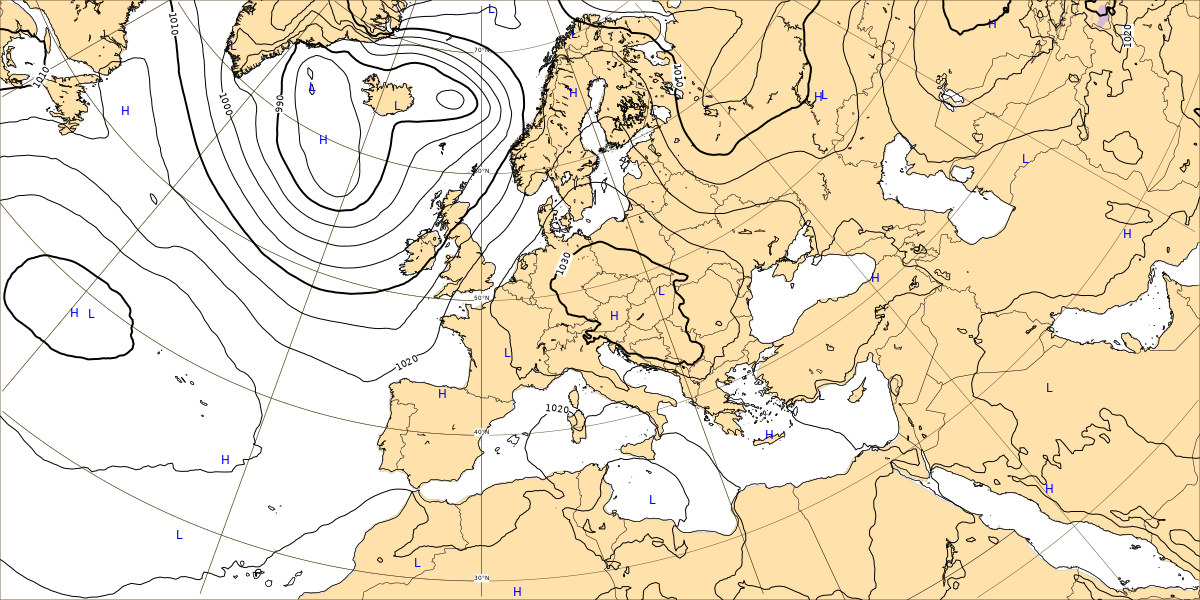
Ensemble spread for mean sea level pressure (hPa)
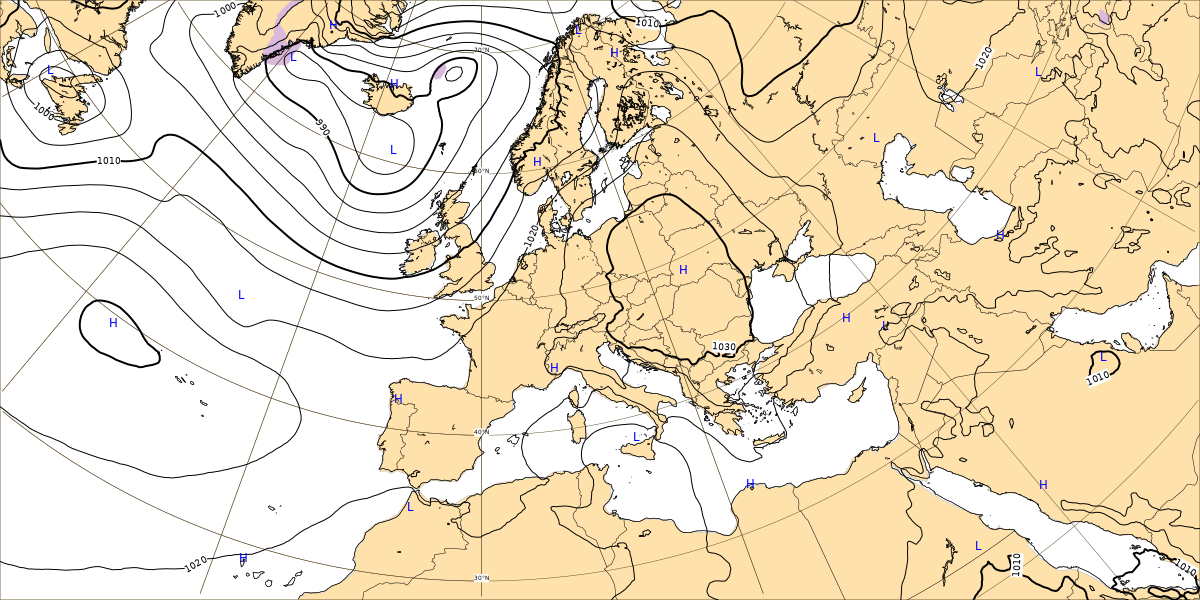
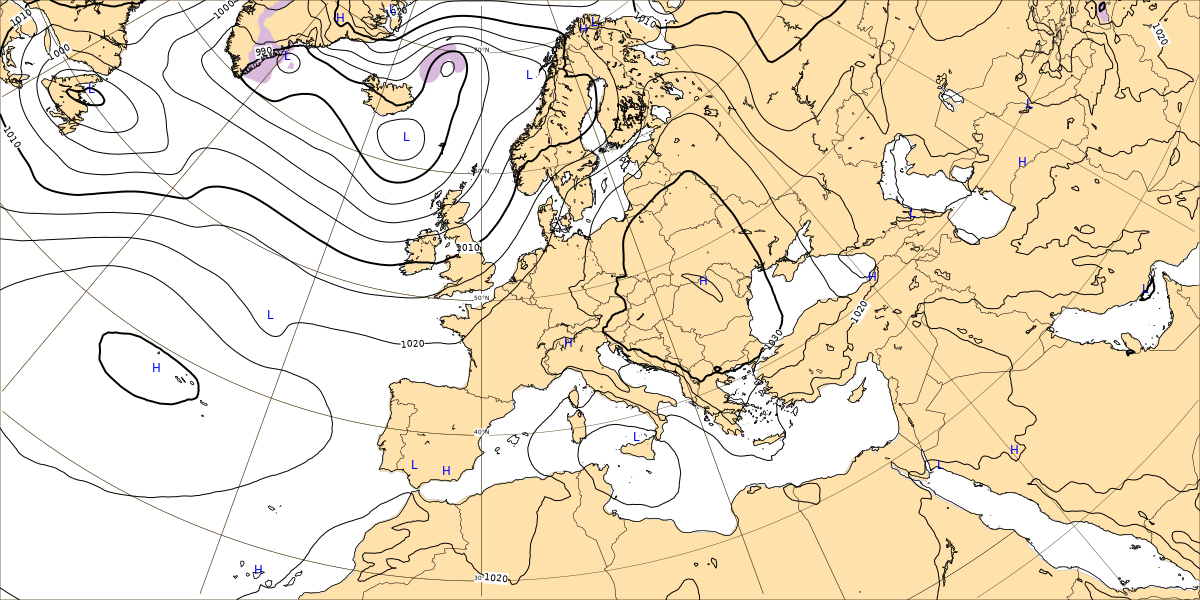
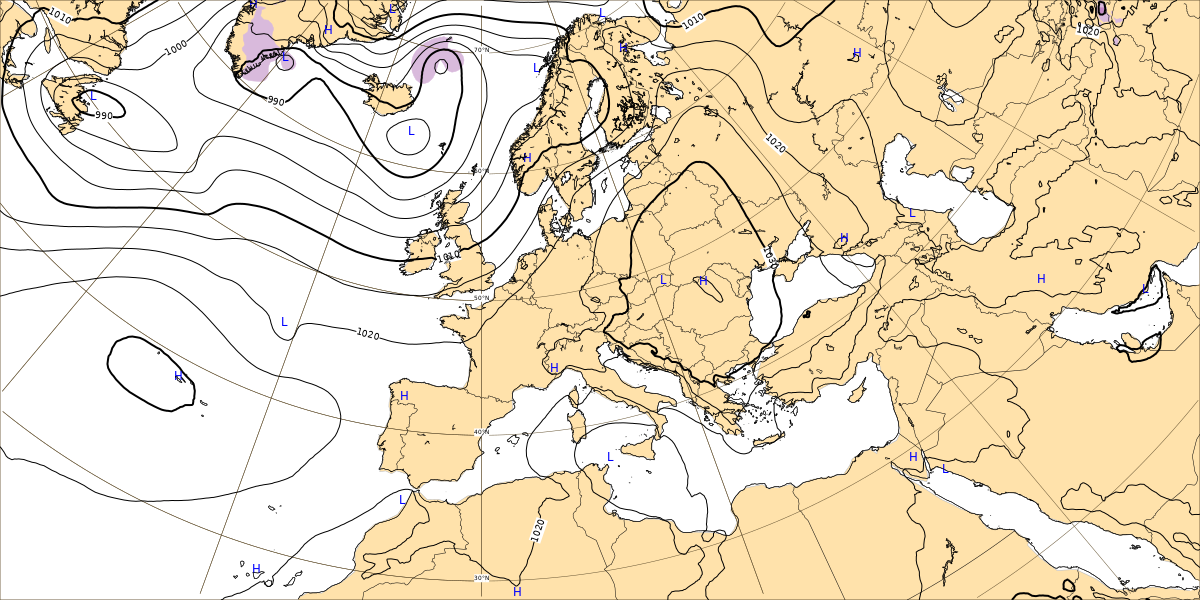
Ensemble mean for mean sea level pressure (hPa)
Ensemble spread for mean sea level pressure (hPa)
Ensemble mean for mean sea level pressure (hPa)

Ensemble spread for mean sea level pressure (hPa)
Ensemble mean for mean sea level pressure (hPa)
Ensemble spread for mean sea level pressure (hPa)
Ensemble mean for mean sea level pressure (hPa)
Ensemble spread for mean sea level pressure (hPa)
Ensemble mean for mean sea level pressure (hPa)
Ensemble spread for mean sea level pressure (hPa)
Ensemble mean for mean sea level pressure (hPa)

Ensemble spread for mean sea level pressure (hPa)
Ensemble mean for mean sea level pressure (hPa)
Ensemble spread for mean sea level pressure (hPa)
Ensemble mean for mean sea level pressure (hPa)
Ensemble spread for mean sea level pressure (hPa)
Ensemble mean for mean sea level pressure (hPa)
Sun 24 Oct 2021 00 UTC (T+0)
This chart is clickable.
The sub-window - location-specific products
Clicking somewhere on the chart above brings up a sub-window for the location clicked on. This sub-window can be moved around within the main web window (click and hold).
Sub-window contents are determined by the selection options on the left hand side. There are 5 options:
10-day meteogram: a 10 day meteogram in standard format
15-day meteogram:a 15 day meteogram in standard format
15-day with climate: a 15 day meteogram with supplementary model climate information for each parameter - specifically the median and other selected percentiles. The model climate used here is a function of forecast lead time.
Plume: 10-day evolution of 3 parameters: 850hPa Temperature, 6h precipitation (up to the time shown) and 500hPa geopotential height
10-day wave: a 10 day wave meteogram
EFI-CDF: compares cumulative distribution functions (CDFs) for recent EPS runs, for the valid day selected on the main web page, with model climate CDFs (computed for the 24-48h lead). The evolution of EPS forecast handling for a specific point can be assessed using this product. EFI evolution is also shown. The most recent forecast is always in red. Greater spread implies a shallower CDF slope, so as lead time decreases, and spread (generally) decreases, CDF lines (generally) become steeper.
Note also that when clicking on a coloured (extreme weather) region of a multi-parameter EFI chart the CDF plot that results will generally show a trend, whereby the later forecasts are more pessimistic. Such trends arise primarily because of 'selective sampling' by the user - they should not be extrapolated.
Note that clickable charts are updated based on the dissemination schedule. So because data from new runs does not all become available at the same time (HRES preceeds ENS, for example) there is scope for the user to activate map charts and click-generated products that are not always synchronised. Rather than reporting a missing link after a click the system is instead configured to show the most recent data it has, so please check titles and labels carefully.